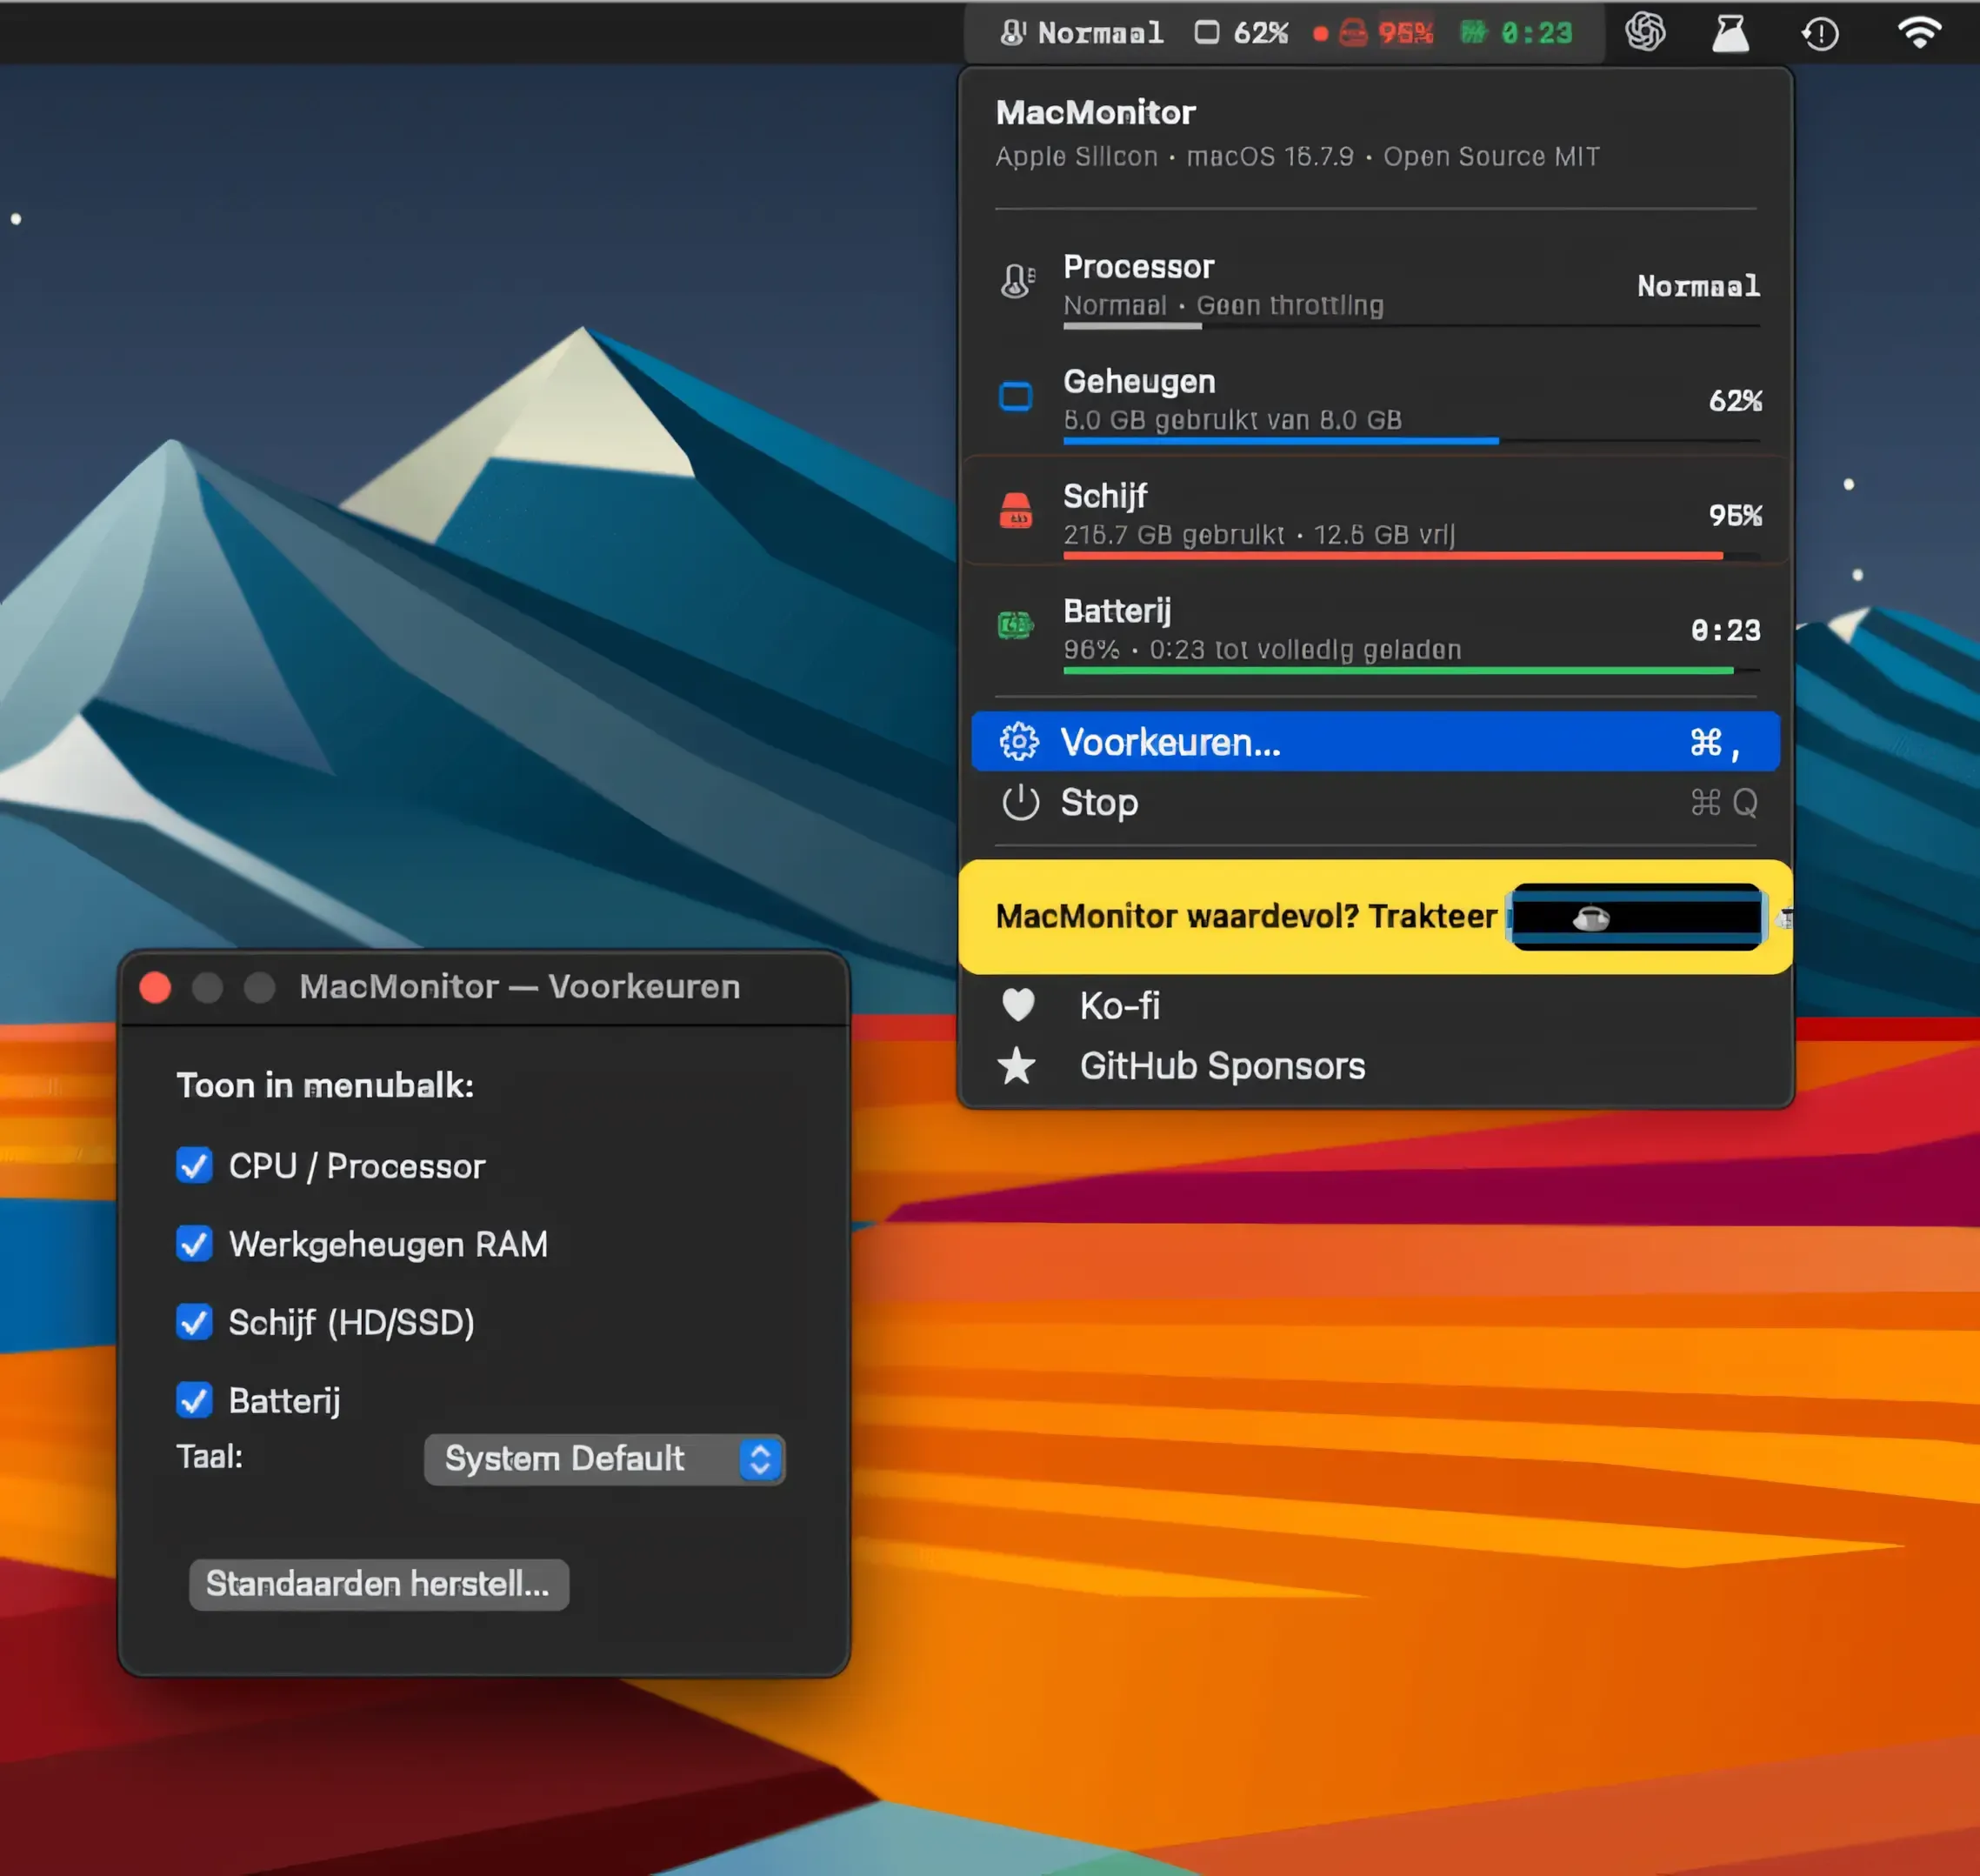
MacMonitor is a free, open-source menu bar utility for macOS that provides at-a-glance visibility into CPU thermal state, RAM usage, disk space, and battery status. (Free, open-source)
The app uses color-coded thermal state indicators — Normal, Warm, Hot, and Critical — to surface CPU temperature concerns without requiring users to open Activity Monitor or third-party monitoring dashboards. RAM usage displays active, wired, and compressed memory segments. Disk space shows remaining capacity for the main volume. Battery estimates are shown on laptops and hidden automatically on desktop Macs.
MacMonitor is written entirely in native Swift with no third-party dependencies, contributing to its 620 KB install size. The MIT-licensed source code is available on GitHub, allowing inspection and modification. The app contains no telemetry, analytics, or network calls; all data remains on-device.
The utility is intentionally minimal: it surfaces the four most commonly needed system metrics without configuration. Users who need more detailed breakdowns, historical graphs, or GPU monitoring should consider a more comprehensive alternative.
System requirements: macOS 13 Ventura or later. Universal Binary (Apple Silicon and Intel). ~620 KB.
Pricing: (Free, open-source — MIT License)
Limitations: MacMonitor does not include GPU monitoring, network throughput display, historical data graphs, or per-process CPU breakdowns. Thermal state reporting relies on macOS APIs and may be less granular than dedicated hardware monitoring tools. No configuration options are available in v1.0.
Alternatives: iStatistica Pro provides comprehensive system monitoring with detailed graphs and widgets ($19.99). Stats is a free, open-source alternative with more metric categories. TopNotch and TopDrop offer simpler lightweight alternatives focused on battery and CPU only.
Suitable for users who want minimal, no-configuration system health monitoring in the menu bar without the resource overhead of heavier monitoring tools.


